- Details
- Written by Gordon Prentice
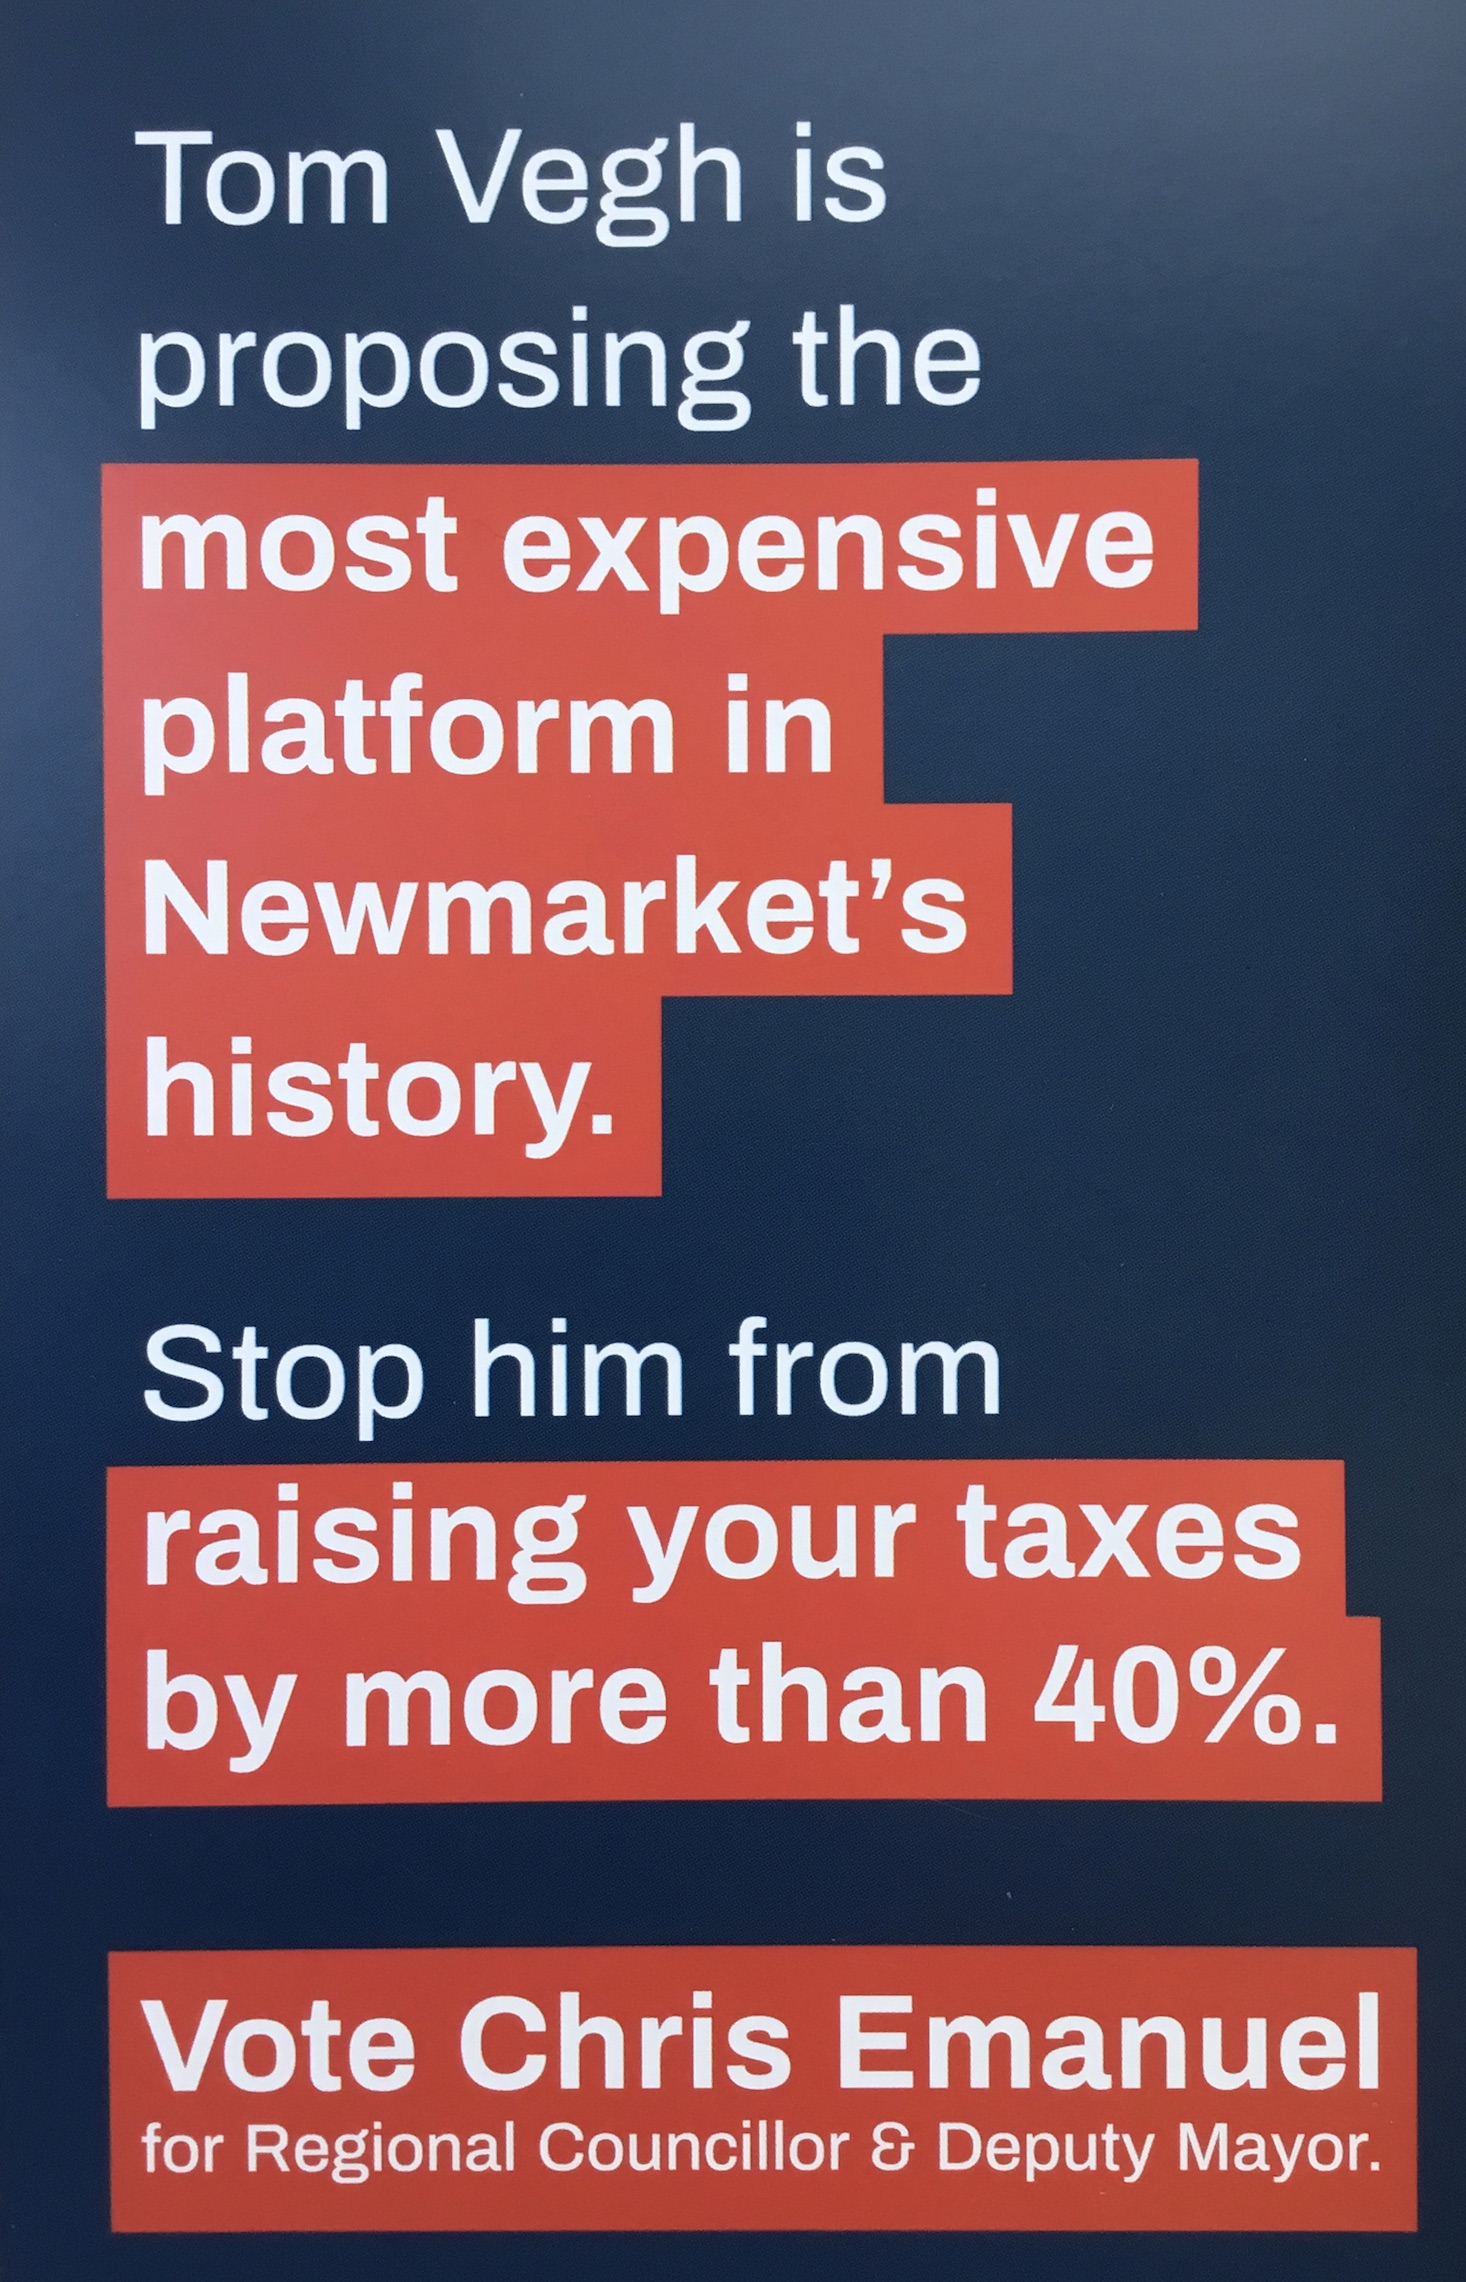
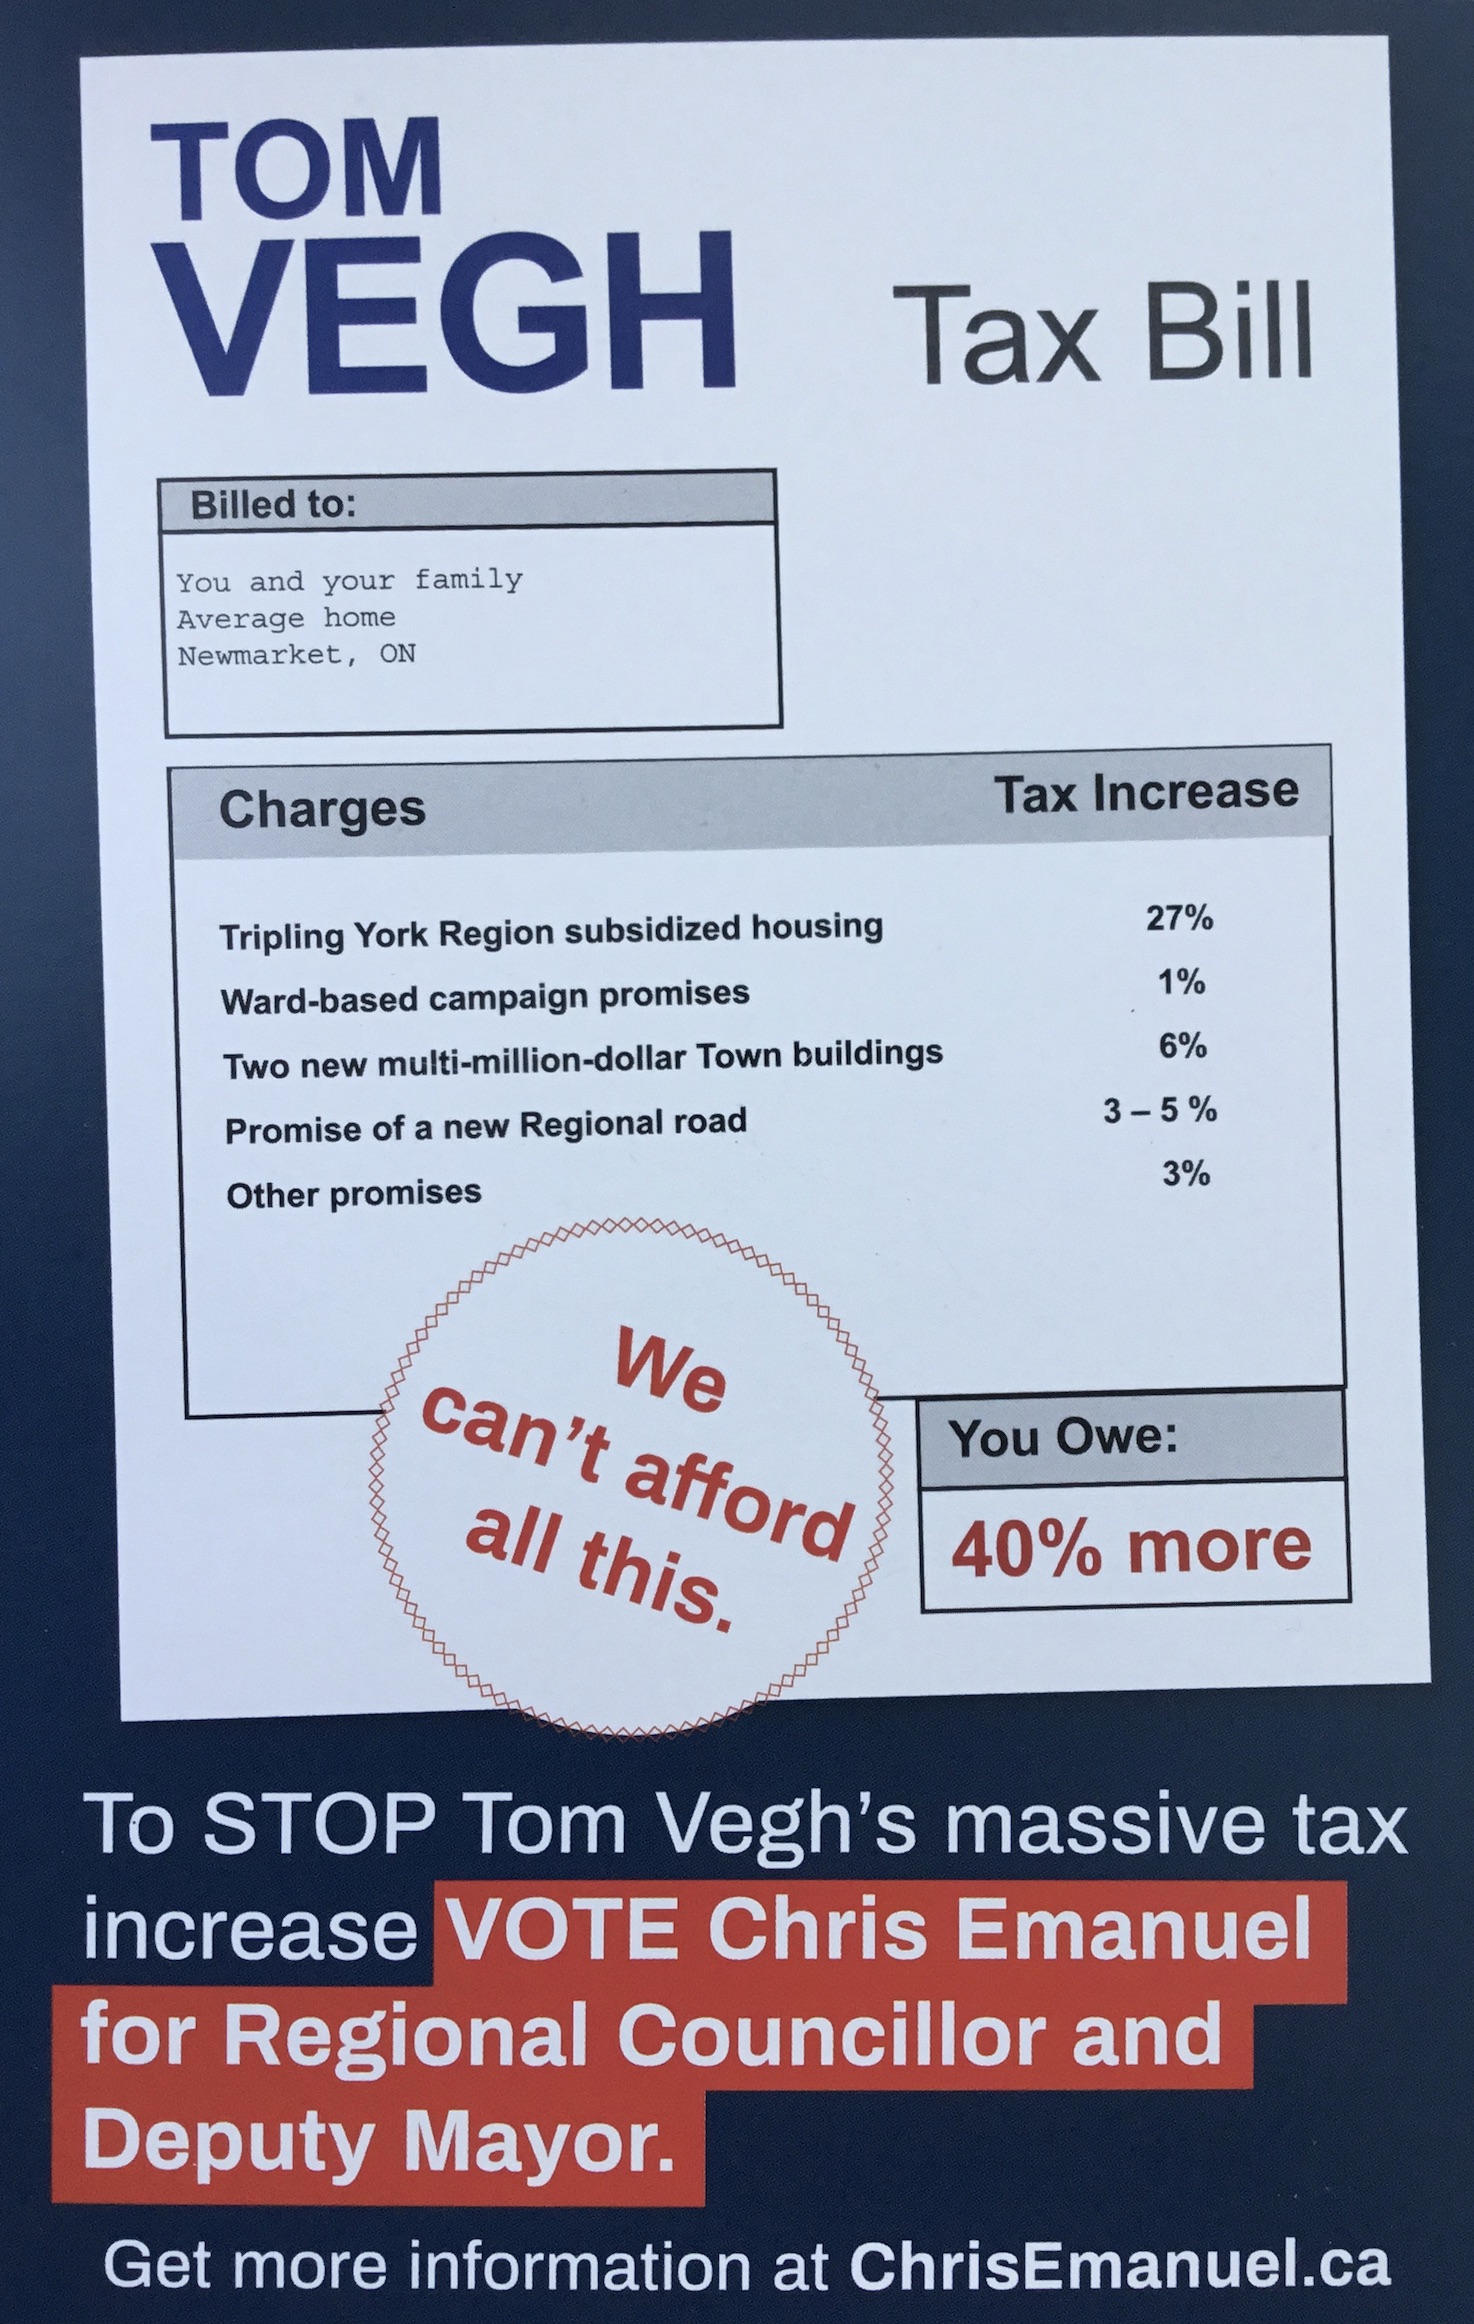
Newmarket’s Regional Councillor candidate Chris Emanuel warns voters they face a tax hike of over 40% if they elect Tom Vegh.
Is this on the cards? Or even remotely plausible? Or just another example of a ludicrous, hyperbolic attempt to smear a political opponent?
Leave aside for the moment that regional councillors – as elevated as they may be – have no powers to impose eye-watering tax increases. They have to persuade their colleagues to vote for policies which have consequences for taxpayers.
Vegh says Emanuel is fearmongering. He says the figures are absolutely untrue.
Emanuel claims Vegh’s support for York Region subsidized housing would mean a staggering 27% increase in our property taxes.
Vegh counters by saying subsidized housing for seniors is 100% funded by the provincial and federal governments.
“Property tax dollars do not fund seniors’ housing subsidies. therefore, this has zero impact on your property taxes. With the growing senior population in Newmarket, there is an urgent need for more affordable seniors housing and I will make it a priority to secure this funding.”
But “subsidized housing” is not restricted to seniors. Can we agree the meaning of terms? York Region subsidizes rental at 212 Davis Drive but the tenants are not all seniors.
New Library and Seniors' Centre
Emanuel excoriates Vegh for pushing for a new library and seniors’ centre predicting this will mean a 6% increase in property taxes.
Vegh explains:
“Building a dual-purpose library/seniors centre is partially funded by development charges. The Town already has $2.6 million dollars in restricted reserves dedicated to this project, and that fund is growing by about $300,000 every year.
… the site I am proposing is already owned by the Town, and you must take into account that the two Town-owned assets (existing seniors centre and library) can be used to offset the cost. The Town will also achieve operational and capital savings by combining the two services. When you add together the annual development fees collected, the value of the two assets, and operational savings, they more than offset any borrowing costs. This new facility should not have any impact on your Newmarket property taxes.”
Emanuel claims Vegh’s “promise of a new Regional road” will add another 3-5% to our taxes. Vegh tells me:
“The Region of York and the Province are already in discussions to build an east/west link between highways 404 and 400. No one is sure what the cost will be, and it is a project still a few years away. It will likely be a tri-party (Federal, Provincial/Regional) funding agreement. Chris Emanuel made up the “3-5%” figure and it has no basis in fact.
Emanuel says Vegh’s ward based campaign promises will marginally increase taxes – by 1%. Vegh hits back:
“Splash pads and other recreational amenities are funded by development charges, and the Town already has $9 million in our restricted reserve fund to pay for them. My plan is to have the building schedule accelerated from 10 years to four years. Again, doing this will have zero impact on your Newmarket property taxes.”
Invented figures
Vegh says he has no clue what is meant by Chris Emanuel’s “other promises” and says the 3% is just another invented figure.
I think Chris Emanuel should tell us how his figures were derived.
Personally, I like election campaigns that rely on facts, not distortions or half-truths or suppositions or meaningless predictions.
For myself, I can confidently predict with 100% accuracy that Tom Vegh’s tax increases will never materialise unless he can persuade a majority of members of Newmarket Council to go along with them.
And what are the chances of that?
This email address is being protected from spambots. You need JavaScript enabled to view it.
- Details
- Written by Gordon Prentice
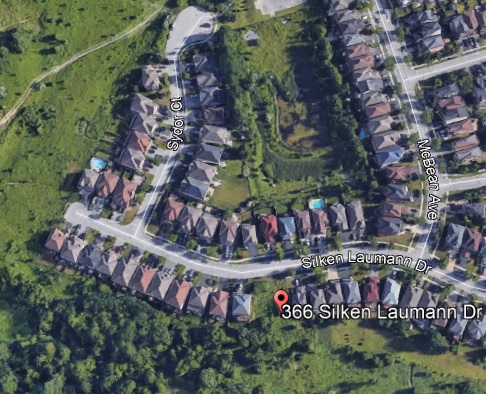
In 2005 Tom Vegh bought land from the Town at Silken Laumann Drive with the aim of developing it. For various reasons this proved to be impossible and the Town bought the land back from Vegh in 2009.
The central question for me is this: Did Vegh get special treatment? Would any other member of the public in similar circumstances be treated in exactly the same way?
Vegh has been a member of Newmarket Council since 2000. He stresses he was not on the Council in 2005 when the deal was done.
We are talking here about a land transaction between an individual and a public body where the details should be publicly available. This information should not be off-limits.
Yesterday Vegh emailed me:
I addressed this on Newmarket Votes on October 4th, but you must have missed it. Here is what I posted. Please correct your story.
It has come to my attention that a few people are making false claims about a building lot my wife and I purchased 13 years ago. Here are the facts:
• In 2005, when I was not on Council, through a blind bidding process managed by a third party, my wife and I were the highest bidders to purchase a residential building lot that the Town declared surplus and advertised in the Era Banner. With the sealed bid was included a mandatory $40,000 deposit. Our goal was to build our dream home.
• We were aware that the Town had an easement over a portion of the property and we had no problem with that because it was not in the allowable building foot print.
• During the due diligence process our engineer discovered that there was an unprotected large storm pipe 40 feet deep under the easement that would require us to build foundations 40 feet deep to protect the pipe, at an additional building cost of $225,000.
• The Town admitted that they were not aware that the pipe was not in a sleeve (protected) and agreed that the need for an extraordinary building foundation ($225,000+) should have been disclosed in the original sales listing.
• It was settled through a mediated court process, not at council. Council only approved the Minutes of Settlement. The Minutes of Settlement was dictated by the mediator (a sitting trial judge) and rested on the agreed statement of facts. It was short and made three orders.
1. revoke the sale of the lot,
2. return our deposit ($40,000) without interest, and
3. each side was responsible for their own legal and professional fees.
To address some of the false statements that have been made on this site:
• The lot is only 40 feet wide and a little over 100 feet deep. There was never an application to turn it into a townhouse development.
• The lot was listed with residential zoning in place. We did not apply for a zoning change.
• The town did not pay our legal or professional fees. That is a claim made by others, but they admit they have no evidence to back it up. The $40,000 we received was the return of our deposit, without interest.
The Town’s Sale of Land policy – which tells me is updated every three years – is silent on reacquisition. Clearly this is something that is not anticipated.
But one of the two stated purposes of the Sale of Land policy is:
“to establish a consistent, transparent and accountable procedure to be followed in the disposition of real property assets by the Town.”
By keeping details of the reacquisition of the Vegh property under wraps the Town is being neither transparent not accountable.
The way to resolve this is for Vegh formally to request the Town to publish full details of the land sale and the subsequent buy-back and to release it from any confidentiality agreement that may apply.
This email address is being protected from spambots. You need JavaScript enabled to view it.
- Details
- Written by Gordon Prentice
Who should we vote for in the election for Regional Councillor?
We have to choose between Tom Vegh and Chris Emanuel. Or, perhaps, Joan Stonehocker.
But from their campaign flyers you’d be hard pressed to tell who is the Conservative (that’s Vegh) and who is the Liberal (Emanuel). Stonehocker looks Green to me. But there is a lot of cross-dressing in politics these days.
A few years ago, the overly eager Vegh excitedly told his Ward 1 constituents he was planning to go to Queen’s Park as a Progressive Conservative MPP but then it all went pear-shaped when the nomination went to the cheat, Charity McGrath.
New Library and New Seniors' Centre
In this election Vegh promises two major spending commitments – a new Library and a new Seniors’ Centre. But these are pipe dreams and are undeliverable unless he can secure five out of the nine votes on Newmarket Council. His vote has the same weight as the mute Kelly Broome’s.
I can’t immediately recall any examples over the past four years when Tom Vegh has persuaded his colleagues to follow his lead on a major Town-wide issue. He doesn’t have a silver tongue and can be hesitant.
Emanuel’s platform of big, bold and positive ideas is, by contrast, a bit of a damp squib. He wants to (a) reorganise the fire service and (b) stop Tom Vegh’s “massive tax increase”.
Emanuel condemns this 40%+ tax increase which, he says, will be generated by Vegh’s commitment to subsidized housing and to
“Two new multi-million-dollar Town buildings.”
Emanuel doesn’t refer explicitly to the proposed new library and senior centre probably because many people would find these quite attractive. Just the kind of big, bold and positive investments the Town needs for a growing (and ageing) population. And there are probably lots of folk out there who would give three cheers for more subsidized housing.
Frightening the voters with talk of "massive" tax increases
Emanuel’s flyer looks at first glance like yet another one from Tom Vegh as it uses the same font and layout. I don’t know if this is clever or misguided. Probably the latter.
In any event, Vegh has been carpet-bombing the Town with his lawn signs and this must count for something.
Once a voter has a VEGH sign on their property I suspect it would feel a bit like cheating to vote for someone else on the day.
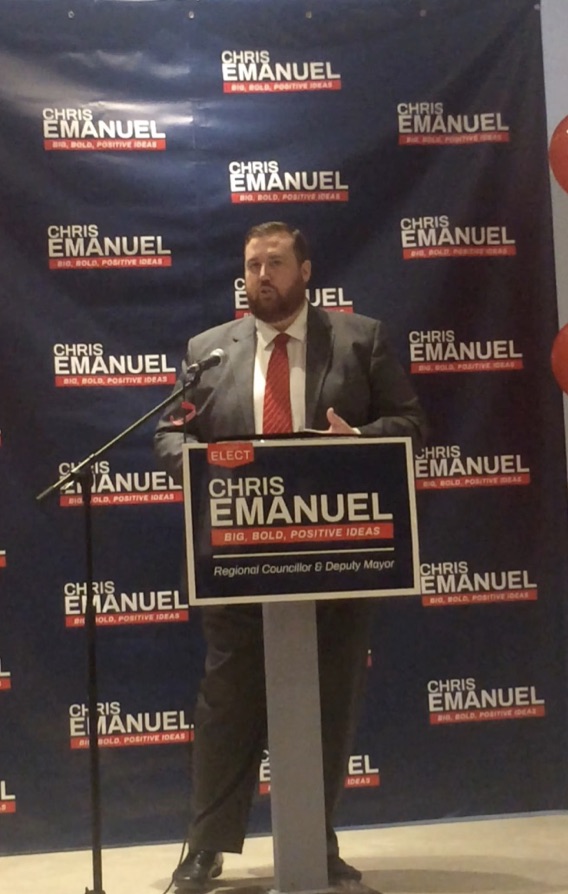
That said, Emanuel undoubtedly has a loyal and enthusiastic following. His campaign kick-off involved a cast of thousands, including the veteran councillor Dave Kerwin who for years has sat next to Vegh at Council.
I am left wondering if Vegh had a campaign launch. If so, it was the best kept secret in Town. I didn’t get an invitation.
Tom Vegh's property dealings and public confidence
We still don’t know the truth about Tom Vegh’s personal property dealings with the Town of Newmarket. The Town won’t spill the beans on the grounds that
"The disclosure of the requested records to the (Newmarket Taxpayers) advocacy group would not increase public confidence in the operations of the Town."
Vegh could, if he chose, tell the voters what happened and why. As it is, it looks bad. Very bad.
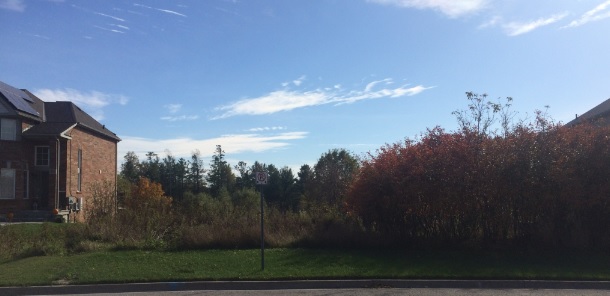
Vegh trumpets his “environmental leadership” but supported a housing development on protected meadowland near Silken Laumann Drive, a stone’s throw from the railway track. I remember the OMB hearing well. It wasn’t my finest hour. I was infuriated by the development and, as I was giving my views in a faltering fashion, I glanced at Vegh to see him smirking.
“Leadership you can count on”
I don’t think so.
This email address is being protected from spambots. You need JavaScript enabled to view it.
- Details
- Written by Gordon Prentice
Weeks before the election the Town of Newmarket is seeking the help of outside consultants to help set “strategic priorities” for the new Council term.
You really couldn’t make it up.
The Town’s retiring Chief Administrative Officer, Bob Shelton, on a lip-smacking salary of $251,343, apparently needs the help of outsiders to understand what our elected officials are really thinking.
Off-the-cuff comments by newly elected councillors – harvested on a bus tour around the Town - are to be taken down by staff and handed to the consultants who will interpret their true meaning.
“Information gathered by staff on the Council Orientation Bus Tours that will include each Member of Council addressing 2 or 3 key questions developed by staff as we travel to each ward (questions to be determined). Staff would provide notes to consultants”
Is this a joke?
Why are we spending “taxpayers’ dollars” on this absurdity?
Who authorised this? Shelton? Van Trappist? Elected officials?
What is the contract worth? We should be told.
And regardless of the dollar value it is the most unbelievable extravagance imaginable.
If our own senior staff can’t do this work in-house they should be replaced by those who can.
This email address is being protected from spambots. You need JavaScript enabled to view it.
The bid documentation tells us:
The consultant(s) will be provided with advance information and it is expected that this information is reviewed in detail by the consultant(s) along with discussions with senior staff. It is expected that this advance work by the consultant(s) will result in a more time efficient and more effective strategic priority planning process. Advance informing documents/processes include:
Ø 2014 – 2018 Council Strategic Priorities and accompanying tracking/reporting documents
Ø 2018 Community Survey Results
Ø New Council Feedback: Information gathered by staff on the Council Orientation Bus Tours that will include each Member of Council addressing 2 or 3 key questions developed by staff as we travel to each ward (questions to be determined). Staff would provide notes to consultants
Ø Carry over and/or Emerging Projects (from senior staff and Council’s perspective )
Ø Review of existing strategy documents (e.g. Secondary Plan, Recreation Playbook, Cultural Master Plan, Economic Development Strategy, Smart City Framework, Innovation Strategy, etc.)
- Details
- Written by Gordon Prentice
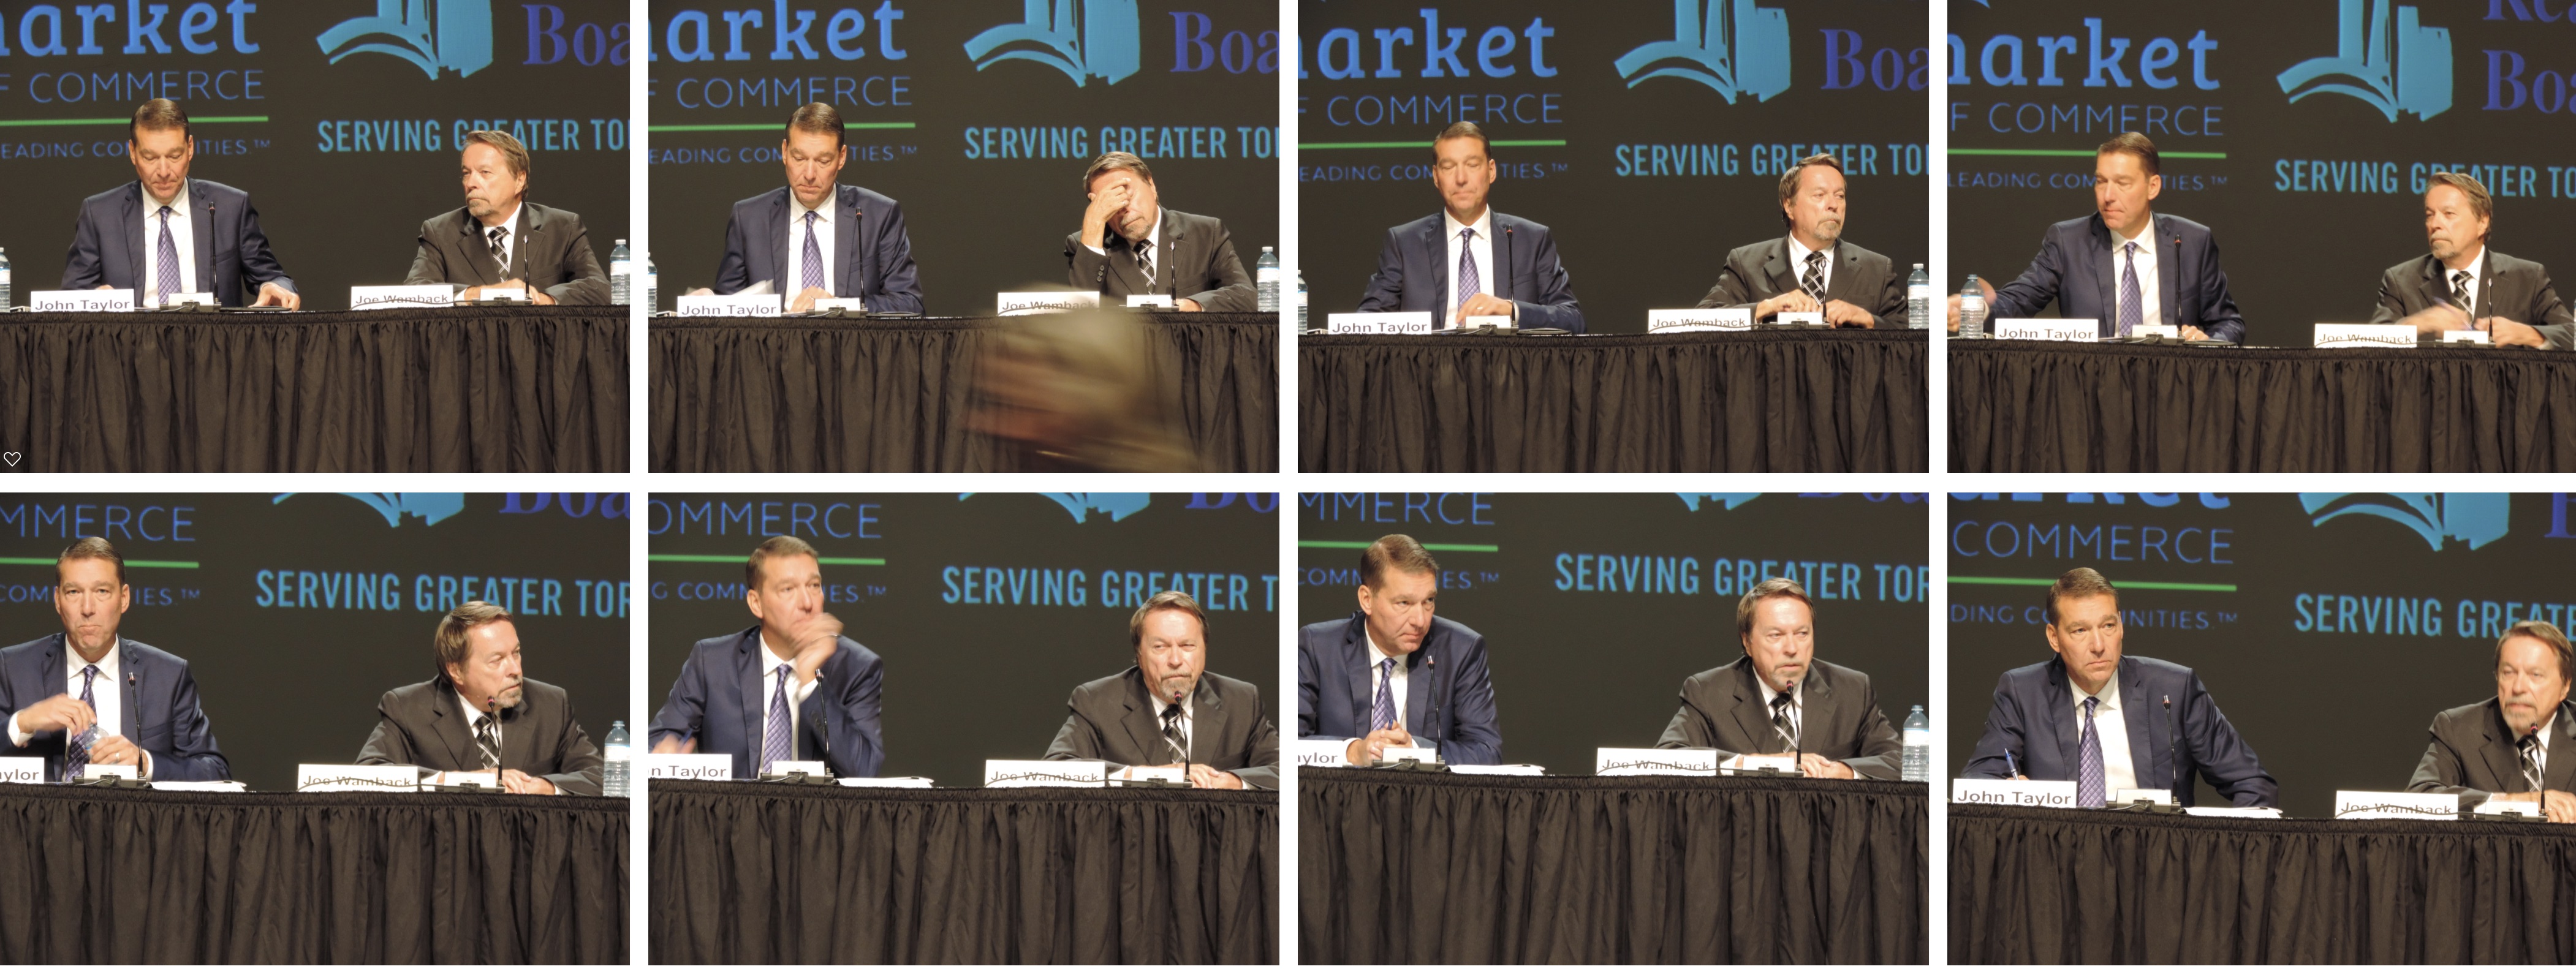
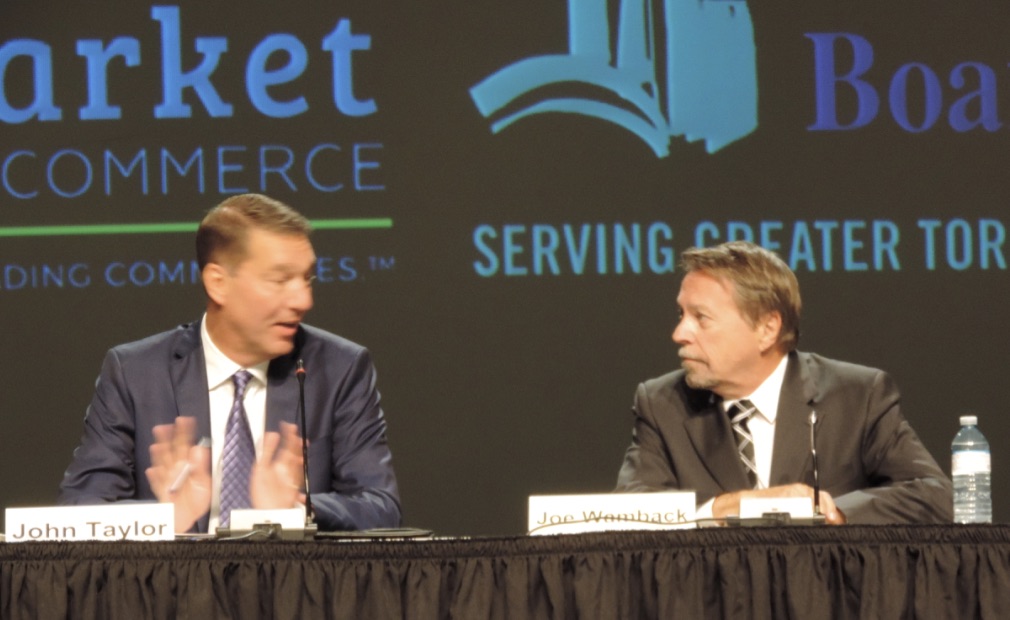
All the signs point to John Taylor coasting to an easy win over his conservative challenger for Mayor of Newmarket.
Still, there’s many a slip twixt cup and lip and things may yet go wrong. Voters can be fickle but, for the moment, I don’t get any sense they are in revolt. They aren’t ready to put 100,000 volts through the Town’s political class and its top bureaucrats.
This is bad news for Joe “I like Doug Ford” Wamback.
There are no opinion polls in Newmarket-Aurora to help us understand how things are going. The best we have are the results of the June 2018 Provincial elections and these are of limited use as predictors.
For one thing, the political parties don’t organise at municipal level in Ontario. For all their well-publicised faults and failings the red, blue and orange labels give the voters a rough idea of what to expect from the candidates.
So, in Ward 4 where I live, I have a pretty good idea of Melissa Williams and her politics as she ran in the Provincial election for the NDP, coming second in votes both in the Ward and in the riding. The other candidates are more difficult to assess.[i]
Wamback the anti-politician
Joe Wamback runs on an explicit anti-politician sentiment, reminding everyone he has hinterland. He has done real jobs and is definitely not a politician. That’s what Doug Ford says ignoring the fact that he was a Toronto councillor for four years and his late brother Rob was Mayor. His father Doug senior was an MPP and his nephew is a councillor. Politics is in his family’s DNA.
Plainly, we need people to take decisions on our behalf. If we didn’t call them politicians we’d have to invent a word meaning the same thing. Taylor has been a politician in some shape or form for 14 years. The real question for me is whether he is any good at the job, not how long he has been doing it.
So, to recap: Taylor is a Liberal by nature and inclination but his well-honed survival instincts, cultivated over many years, make him a fiscal conservative. Joe Wamback is a dyed-in-the-wool Doug Ford Conservative.
If Wamback can turn this election into a contest between Conservatives v Liberals he stands a chance. This is a Conservative leaning riding. (It includes the whole of Newmarket and a bit of Aurora.) At the election in June the Ford PCs got 24,813 votes to the Liberals 11,840 (with the NDP on 12,405).
Term limits
Wamback believes all politicians have a shelf-life. He sets an eight-year term limit on his tenure as Mayor. He knows that change is a powerful motivator and he thinks Taylor has been around for far too long.
For Taylor, this election is not about Party politics. It is about who can deliver the most for the Town. He is not going to bad-mouth the new Premier. After all, if elected, he will have to deal with Doug Ford and he is not going to poison the well.
Most people have to try pretty hard to dislike John Taylor. To me, he comes across as well-meaning and affable. Critics brand him as the lead member of the “old boys’ club” – the people who have been running the Town for decades.
In most votes Taylor can count on support from Conservatives like Jane Twinney (who was the PC candidate for Queen’s Park in 2014 – but lost to Chris Ballard) and Liberals such as Chris Emanuel (who stood down from Newmarket Council in 2014 but is now running for Regional Councillor). Like a skilled circus performer, Taylor has always been adept at riding two horses at the same time.
Taylor keeps an eye on the ball
At last week’s Question and Answer with the Newmarket Taxpayers Advisory Group (NTAG) Taylor paints a picture of himself that fleshes out what we already know. I learn that in earlier days he was a tennis linesman keeping an eye on the ball when famous names like Jimmy Connors were on court. Astonishingly, I discover he was a Canadian croquet champion. And he was the co-owner of a trucking company than ran five or six trucks a day out of Pearson airport.
Along the way he collected a quiver full of academic qualifications. He could call himself Dr Taylor but, wisely, chooses not to.
The one unexpected question that throws Taylor off balance is this:
“What will you do if you lose?”
After a brief moment of reflection he answers:
“I have no real idea. Perhaps become a Professor.”
Clearly, he hasn’t given the possibility of losing more than a moment’s thought.
Despite trying, the NTAG audience never really lays a finger on him. He is asked about Newmarket’s ballooning debt. He says the Town is paying debt down aggressively. Reserves have tripled.
He confidently talks about the big issues: Mulock Farm, the GO Rail station, parking in the old downtown and gives everyone the impression he has the answers or, at the very least, has given a great deal of thought to the issues.
Mayor’s email blast
He is asked about transparency and promises a regular Mayoral email blast giving insights into his thinking. This will be a step forward. He can be quite inscrutable. He says he will meet people who want to talk to him. These are the positives.
But the Taylor I know realises information is power and he has a tendency to hoard it – or, when it suits his purpose, trade it.
Early on in the Slessor Square saga I recall Taylor telling a few of us he would let us have some information but only if we kept it to ourselves. Since there were lots of people out there relying on our little Shrink Slessor Square group to give the truth about what was happening and not dissemble, this, for me, was a bridge too far.
Taylor is asked about the proposed new GO rail station at Mulock Drive and the possibility of grade separation (getting rid of the level crossing). He baffles me with this:
“What does grade separation do to the texture of the community? It is very impactful.”
Seems to me long lines of traffic waiting for the level crossing barrier to rise can be very impactful too.
Consensus or intelligent debate
He is asked if it is more important for Council to have consensus or intelligent and thoughtful debate. He says they are not mutually exclusive. You have a debate. You have a vote and the chips fall where they may. He is not afraid of dissent.
He is asked about a new library and seniors’ centre – something Tom Vegh is pushing for. Taylor is totally non-commital. He wants us to believe you cut your cloth according to your means. Mulock Farm was a one off. He says we shouldn’t have a special tax to pay for special projects. (Personally, I take the view that if you want something badly enough there is always a way to pay for it. Indeed, Mulock Farm makes the point.)
Let me be frank
He is asked about Newmarket Theatre’s $750,000 loss. He says most municipal theatres are subsidised. What about marijuana? He has big reservations. What about the Mayor’s pay? He says it is difficult to compare like with like. He says the Mayor gets about $170,000 plus expenses but doesn’t get into the weeds.
Now I hear him say
“I’ll be frank in this room.”
and I know he is not gonna be frank. Moments later he is telling us
“I don’t know if I am being too frank.”
and then he equivocates.
When John Taylor is elected Mayor expect more of the same. With Taylor the die is already cast. It will be steady as she goes. For years Taylor has, in effect, been running the show. He crushed the Mayor on the hugely important Clock Tower vote on 28 November 2016, making it perfectly clear he was the main man.
Seizing the moment
Politics of course must have a purpose.
There is no point being a Tony Van Trappist, pocketing the money and being a glorified administrator. Taylor’s bold decision – with his colleagues - to buy Mulock Farm should be applauded.
He told the NTAG audience it was an opportunity that doesn’t come around very often and he
“seized the moment”.
It was absolutely the right thing to do. The fact that the Mulock family wanted their land zoned for development and not for open space added, for me at least, a certain piquancy to the issue.
Now the person sitting next to me warns us not to drink Town water as it is poisoned from the microwave dishes on top of the water towers. How curious! I smile at her while Taylor keeps a straight face, reassuring everyone it is safe to drink.
Now someone asks Taylor if he respects NTAG.
Taylor thinks hard before admitting:
“I don’t always respect the topics you pursue.”
That sounds like something a politician would say.
This email address is being protected from spambots. You need JavaScript enabled to view it.
You can read the NewmarketToday coverage of the NTAG meeting here.
[i]In the June election, in Ward 4 the sitting Liberal MPP, Chris Ballard, got 830 votes; Williams for the NDP got 1054 votes and Elliott for Doug Ford’s PCs romped home with 1663 votes.
Page 139 of 284